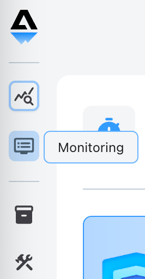
The Monitoring page is where you'll see incoming prompts, responses, signal results, and other information. To navigate there, tap the Monitoring icon on the left.
⚠️ Content Warning
This documentation may contain examples of potentially offensive or harmful content used to demonstrate Aiceberg's Signal detection. These examples are included for technical education purposes only and do not reflect our organization's values. For more information, see the full Content Warning.
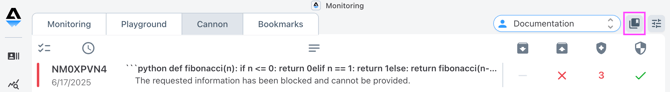
The table on this page is filtered to show only one Profile at a time. The dropdown menu to the right allows you to choose which Profile you'd like to view. The tabs indicate the log group for data that shows in the window.
- Monitoring contains your live traffic, including everything sent via API
- Playground shows only inputs typed into that window
- Cannon shows all Collections inputs that have fired through the tool
- Bookmarks contains manually bookmarked inputs
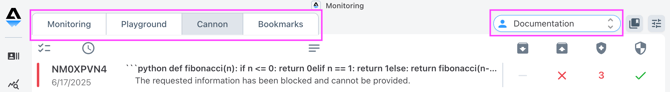
The contents in the table are controlled by filtering and selecting columns to show. The filter/select menu is on the far top right.
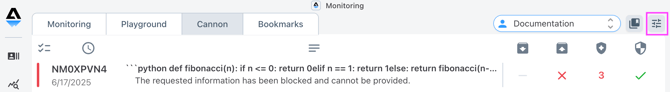
When you open the menu, you'll land on the filtering drawer. This view includes:
- Filter selector
- Cannon run and Collection pickers (will only filter on the Collections tab)
- The "Only show sessions" checkbox will filter out child prompts. Learn more about Sessions here.
- Date/time
- Prompt and response actions (none, edit, block)
- Signals (e.g., PII, Secrets, Toxicity, etc.)
- Sentiment
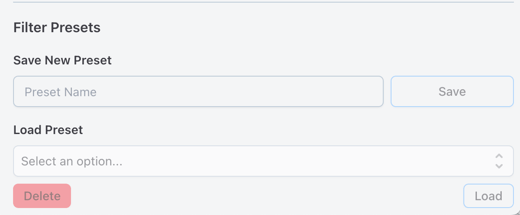
 Your browser will remember your choices and show you the last Monitoring view you set up. However, if you'd like to save a preset, scroll to the bottom of this filter view to name your current set of filters. Any named filter sets will be available as a preset in this menu.
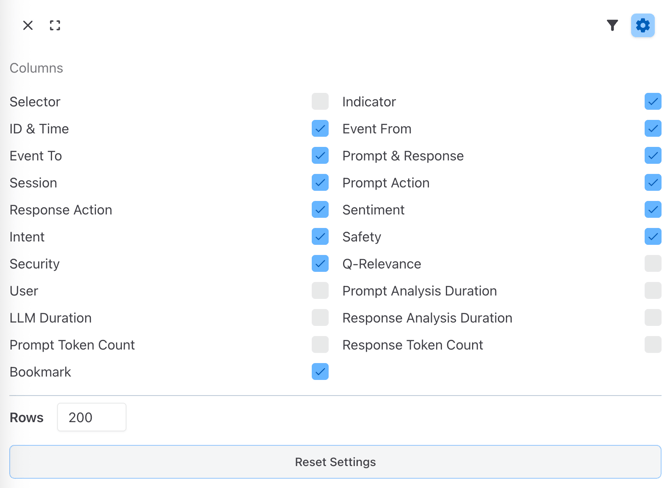
The settings view allows you to choose which columns to show in the table and how many rows (on the slider.) Most of the columns are self-explanatory, however, they do include:
- Selector - for select and multi-select actions
- Sessions (learn more about Sessions here)
- Event to and from (learn more about Events)
- Security - a roll up of Instruction Signals (learn more about Signals)
- LLM Duration - time in MS for the LLM response
- Bookmark - user set flag on prompts to show in the Bookmarks tab
- Indicator - the alert level of the input based on the configuration of the Profile (learn more about Profile config)
- red - Signal was triggered and the content was blocked
- yellow - Signal was triggered but not blocked
- green - no Signals were detected
- Safety - a roll up of Context, Information, and Content Signals (learn more about Signals)
- Q-Relevance - the Relevance score result (learn more about Relevance in Profiles)
Tapping the Collections icon will open the Selector column so you can choose prompts you'd like to send to a Collection. Learn more about adding prompts to a Collection.